The goal of the experiment is measuring and interpreting the pressure drop between the channel inlet and the pressure on the surface of the central bar, for different azimuthal and inclination angles, \(\theta \) and \(\alpha \). In order to generalize the results, the pressure difference will be presented in dimensionless form as the Euler number:
$$Eu_w\equiv \fracp_w-p_i\frac12\rho u_i^2 (1)$$
where \(\rho \) is the fluid density, \(u_i\) is the average inlet velocity, \(p_i\) is the inlet pressure and and \(p_w\) is the pressure at a given point of the rod wall. The inlet velocity was fixed within three different range levels determined by the opening of the inlet valve. The resulting velocities range between 6 and 10 m/s, corresponding to channel Reynolds numbers, \(Re\equiv u_iH/\nu \) (where \(H\) is the height of the channel and \(\nu \) is the kinematic viscosity) between 40,000 and 67,000. The rod Reynolds numbers (\(Re\equiv u_id/\nu \)) range between 2500 and 6500. The turbulent intensities estimated through the relative standard deviation of the signal recorded in the Venturi tube averages 5%.
Figure 4 shows the dependence of \(Eu_w\) with the azimuthal angle \(\theta \), parametrized by three inclinations, \(\alpha \) = 30°, 50° and 70°. The measurements are separated in three graphics according to the diameter of the rods. It can be seen that the resulting Euler numbers, within the experimental uncertainties, are independent of the flow rate. The general dependence with θ follows the usual trend of the wall pressure about the perimeter of a round obstacle. At angles facing the flow, i.e. θ from 0 to 90°, the rod wall pressure decreases reaching a minimum value at 90°, corresponding to the gap between bars where the velocity is maximum due to the restriction of the flow area. Following, there is a pressure recovery for θ from 90° to 100°, and afterwards the pressure remains uniform due to the separation of the boundary layer at the back the rod wall. Notice that there is no shift of the angle of minimum pressure, indicating that possible interference from adjacent shear layers, like Coanda effect, are of secondary nature.
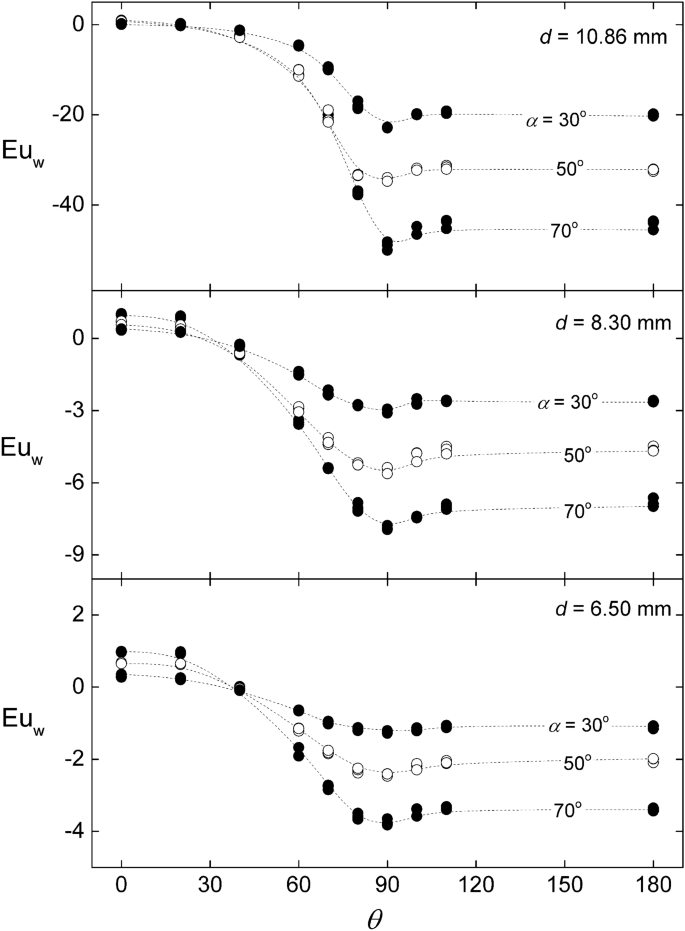
Variation of the wall Euler number around the rod for different inclinations angles and rod diameter. Created with Gnuplot 5.4, www.gnuplot.info.
In what follows, we present an analysis of the results based on the hypothesis that the Euler number can be estimated solely by geometric parameters, namely, the characteristic length-ratios \(d/g\) and \(d/H\) (where \(H\) is the height of the channel), and the inclination angle \(\alpha \). A popular practical rule of thumb states that the fluid–structure forces on yawed rods are determined by the projection of the inlet velocity normal to the rods axis, \(u_n=u_i\mathrmsin\alpha \) . This is sometimes referred as the independence principle. One of the goals of the following analysis is to check whether this principle holds in our case, where flow and obstacles are confined inside a closed channel.
Let us consider the pressure measured at the front of the surface of the middle rod, i.e., θ = 0. According to the Bernoulli equation, the pressure at that position, \(p_o\), satisfies:
$$p_o-p_i=\frac12\rho \left(u_i^2-u_o^2\right)$$
(2)
where \(u_o\) is the fluid velocity adjacent to the rod wall at θ = 0, and we are assuming that the irreversible losses are relatively small. Notice that the dynamic pressure is cast independently in the kinetic energy terms. If \(u_o\) were null (i.e., stagnation conditions) the Euler number should be unity. However, it can be observed in Fig. 4 that at \(\theta =0\) the resulting \(Eu_w\) are close but not exactly equal to that value, particularly for larger inclinations. This suggests that the velocity on the rod surface at \(\theta =0\) does not vanish, which can be chocked up to the upward deflection of the current lines produced by the inclination of the rods. Since the flow is confined at the top and the bottom of the test section, such deflection should generate a secondary recirculation that increases the axial velocity at the bottom and reduced the velocity at the top. Assuming that the magnitude of the mentioned deflection is the projection of the inlet velocity over the axis rod (i.e., \(u_i\mathrmcos\alpha \)), the corresponding Euler number results:
$$Eu_o\equiv \fracp_o-p_i\frac12\rho u_i^2=\mathrmsin^2\alpha $$
(3)
Figure 5 compares Eq. (3) with the corresponding experimental data, showing good agreement. The average deviation is 25% with 95% confidence level. Notice that Eq. (3) is in agreement with the independence principle. Likewise, Fig. 6 shows that the Euler numbers corresponding to the pressure on the surface at the back of the rod, \(p_180\), and at the exit of the test section, \(p_e\), also follows a trend proportional to \(\mathrmsin^2\alpha \). However, in both cases, the coefficient depends on the rods diameter, which is reasonable since the latter determines the obstructed area. This feature is similar to the pressure drop across an orifice plate, where the flow passage is partially reduced at a certain location. In the present test section, the role of the orifice is played by the gap between bars. In such cases, the pressure experiences a substantial drop at the restriction and is partially recovered in the backward expansion. Viewing the restriction as a blockage in the direction normal to the rods axis, the pressure drop between the front and the back of the rods can be written as18:
$$p_o-p_180=c_d \left(\fracA_f^2A_m^2-1\right)\frac12\rho u_n^2$$
(4)
where \(c_d\) is a drag coefficient accounting for the partial pressure recovery between θ = 90° and θ = 180°, and \(A_m\) and \(A_f\) are the minimum and free cross section per unit length normal to the rod axis, which are related to the rod diameter by \(A_f/A_m=\left(g+d\right)/g\). The corresponding Euler number is:
$$Eu_0-180\equiv \fracp_o-p_180\frac12\rho u_i^2= c_d \left(\fracdg+2\right)\fracdg \mathrmsin^2\alpha $$
(5)
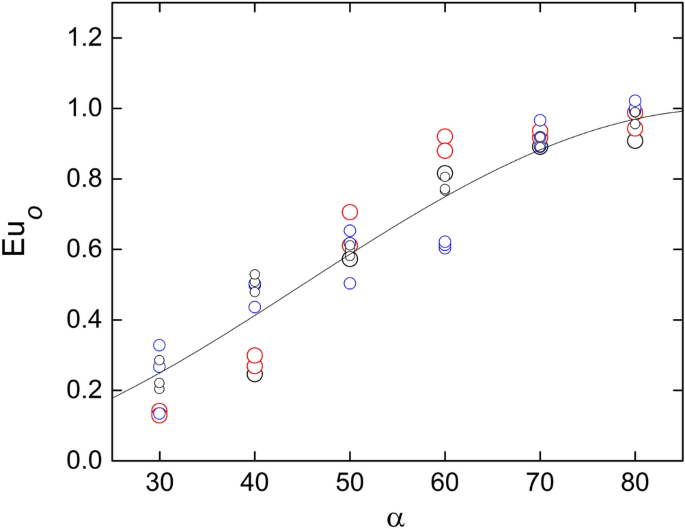
Variation of the wall Euler number at \(\theta =0\) with the inclination angle. The curve corresponds to Eq. (3). Created with Gnuplot 5.4, www.gnuplot.info.
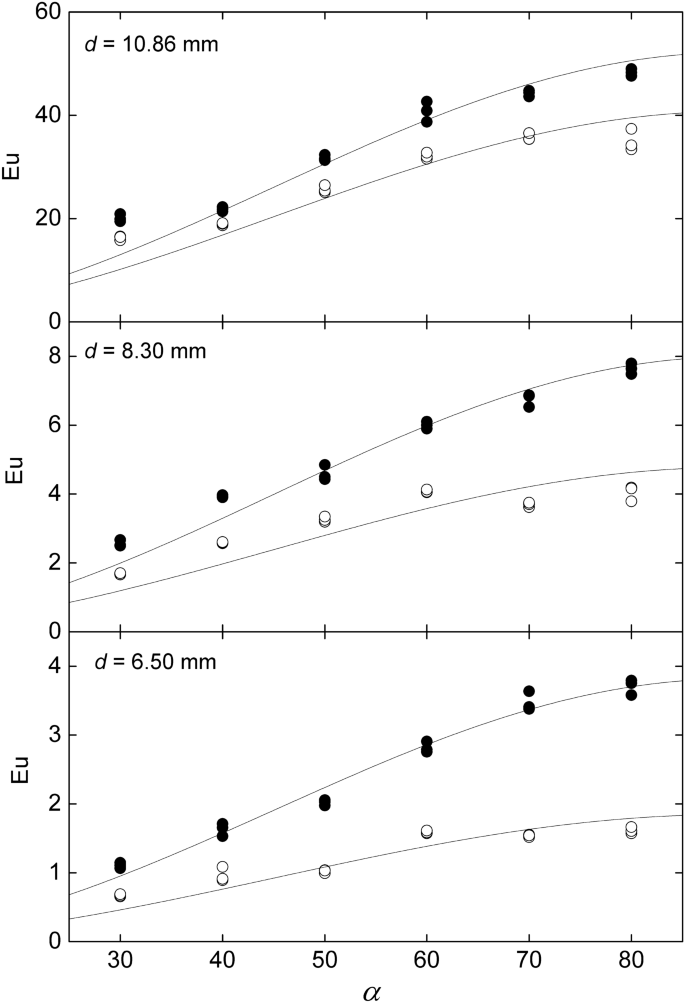
Variation of the wall Euler number, at \(\theta =180^o\) (full symbols) and the exit, (empty symbols) with the inclination angle. The curves corresponds to the independence principle, i.e., \(Eu\propto \mathrmsin^2\alpha \). Created with Gnuplot 5.4, www.gnuplot.info.
Figure 7 shows the dependence of \(Eu_0-180/\mathrmsin^2\alpha \) with \(d/g\) showing excellent agreement with Eq. (5). The resulting drag coefficient is \(c_d=1.28\pm 0.02\) with 67% confidence. Likewise, the same graphic also shows that the total pressure drop between the inlet and the outlet of the test section follows a similar trend, but with a different coefficient accounting for the pressure recovery in the backspace between the bars and the channel exit. The corresponding drag coefficient is \(c_d=1.00\pm 0.05\) with 67% confidence.
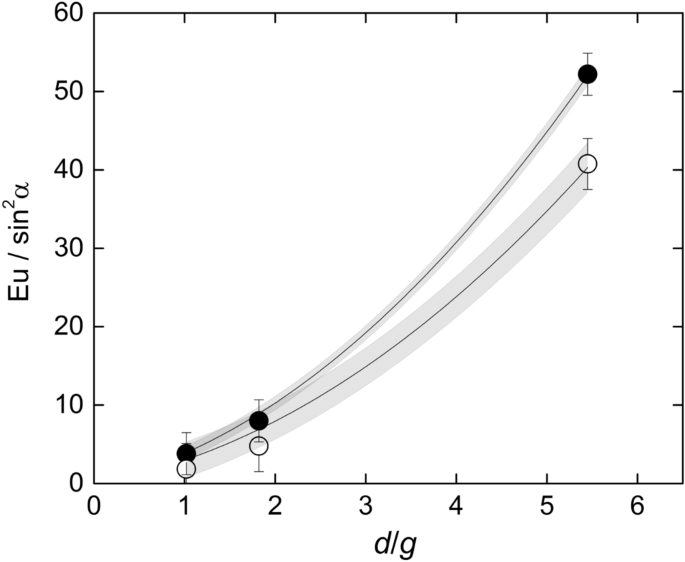
Dependence of the drag coefficient with \(d/g\) for the pressure drop between the front and the back of the rod \(\left(Eu_0-180\right)\) and the total pressure drop between the channel inlet and outlet. The grey zones are the 67% confidence bands of the correlations. Created with Gnuplot 5.4, www.gnuplot.info.
Pressure on the rod surface at
\(\theta =90^o\)
The minimum pressure on the rod surface, \(p_90\), at θ = 90°, requires a special treatment. According to the Bernoulli equation along a current line passing through the gap between bars, the pressure, \(p_g\), and the velocity,\(u_g\), at the center of the gap between bars (which coincides with the middle point of the channel) are related by:
$$p_i-p_g=\frac12\rho \left(u_g^2-u_i^2\right)$$
(6)
The pressure \(p_g\) can be related to the rod surface pressure at θ = 90° by integrating the pressure profile across gap separating the central rods between the middle point and the wall (see Fig. 8). The balance of forces gives19:
$$\fracdpdy=\rho K\left(y\right) u_g^2$$
(7)
where \(y\) is a coordinate that goes from the center point of the gap between the central rods perpendicularly to the rod surface, and \(K\) is the curvature of the current line at position \(y\). To produce an analytical assessment of the pressure on the rod surface, let us assume that \(u_g\) is uniform and that \(K\left(y\right)\) is linear. These assumptions were verified with numerical calculations. At the rod wall the curvature is determined by the ellipsoidal section of the bar at angle \(\alpha \), namely, \(K\left(g/2\right)=\left(2/d\right)\mathrmsin^2\alpha \) (see Fig. 8). Then, regarding that due to the symmetry the curvature of the stream lines vanishes at \(y=0\), the curvature at a generic coordinate \(y\) is given by:
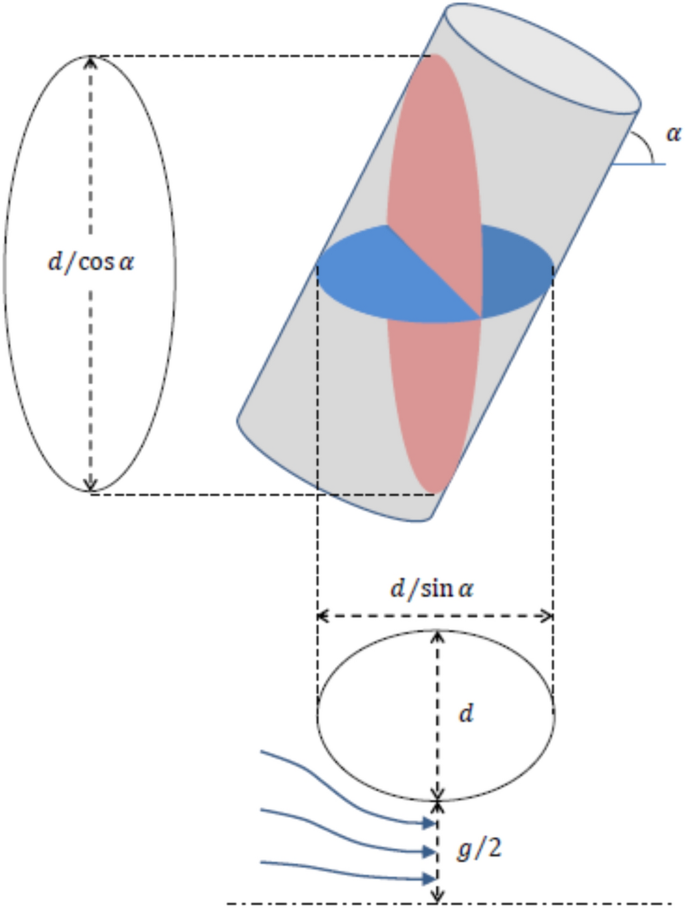
Diagram of the characteristic cross sections, frontal (left) and from above (below). Created with Microsoft Word 2019,
$$K=-\frac4 \mathrmsin^2\alpha g dy$$
(8)
Integrating Eq. (7) gives:
$$p_90-p_g=-\frac12\rho \left(\fracgd\mathrmsin^2\alpha \right)u_g^2$$
(9)
Combining Eqs. (6) and (9), \(u_g\) can be calculated as:
$$u_g=u_i\sqrt\frac1-Eu_901+\fracgd\mathrmsin^2\alpha $$
(10)
where
$$Eu_90\equiv \fracp_90-p_i\frac12\rho u_i^2$$
(11)
On the other hand, by mass conservation, the average velocity \(\langle u_g\rangle \) over the plane perpendicular to the flow at the measurement position is related to the inlet velocity as:
$$\langle u_g\rangle =u_i\fracA_iA_g$$
(12)
where \(A_i\) is the cross-section flow area at the channel inlet, and \(A_g\) is the cross-section flow area at the measurement position (see Fig. 8) given respectively by:
$$A_i=3H\left(d+g\right)$$
(13)
$$A_g=A_i-\frac3\pi 4 \fracd^2\mathrmcos\alpha $$
(14)
It should be noticed that \(u_g\) is not equal to \(\langle u_g\rangle \). In effect, Fig. 9 depicts the velocity ratio \(u_g/\langle u_g\rangle \), calculated from Eqs. (10)–(14), plotted against the ratio \(d/g\). Although there is some dispersion, it is possible to identify a trend, which was approximated by a second order polynomial:
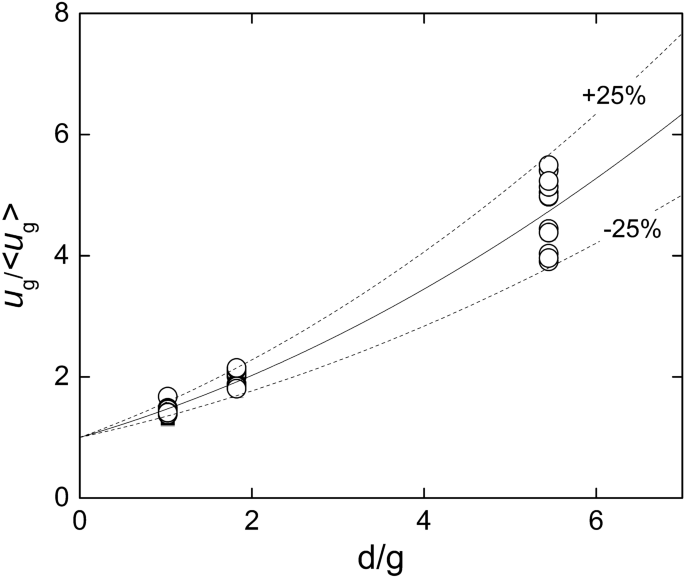
Ratio between the maximum \(u_g\) and the average \(\langle u_g\rangle \) velocities at the central cross section of the channel \(.\) The solid and dashed curves corresponds to Eq. (5) and the bounds varying \(\pm 25\%\) of the corresponding coefficients. Created with Gnuplot 5.4, www.gnuplot.info.
$$\fracu_g\langle u_g\rangle \cong 1+0.41 \fracdg+0.05 \left(\fracdg\right)^2$$
(15)
Combining Eqs. (10) and (15) yields:
$$Eu_90=1-\Gamma ^2$$
(16)
where
$$\Gamma =\left[\frac1+0.41 \fracdg+0.05 \left(\fracdg\right)^21-\frac\pi 4 \fracdH\frac1\left(1+\fracgd\right)\mathrmcos\alpha \right]\sqrt1+\fracgd\mathrmsin^2\alpha $$
(17)
Figure 10 compares the experimental results for \(Eu_90\) with Eq. (16). The average relative deviation is 25% with a confidence level of 95%.
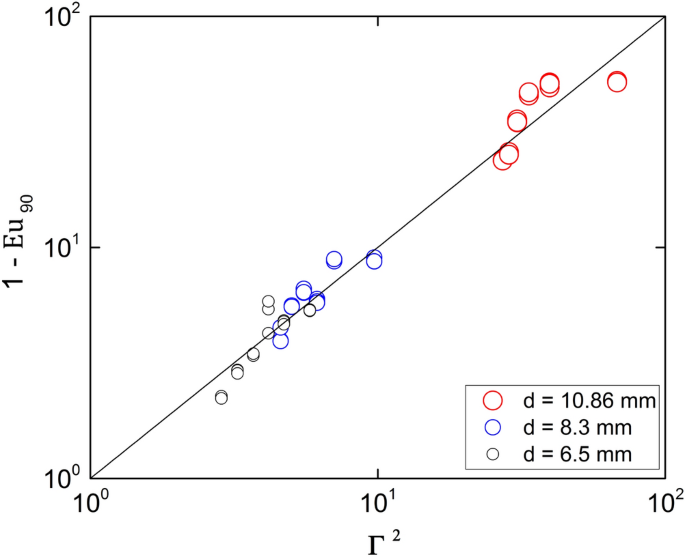
Wall Euler number at \(\theta =90^o\). The curve corresponds to Eq. (16). Created with Gnuplot 5.4, www.gnuplot.info.
Net force acting on the rods
The net force, \(f_n\), acting on the central rod perpendicular to its axis can be calculated by integrating the pressure over the rod surface, as:
$$f_n=\fracH\mathrmsin\alpha \fracd2 \oint p_w\,\mathrmcos\,\theta d\theta $$
(18)
where the first coefficient is the rod length inside the channel and the integral is performed between 0 and 2π.
The projection of \(f_n\) on the stream direction should match the pressure force between the channel inlet and outlet, barring friction forces parallel to the rods and minor momentum flux imbalances due to incomplete profile development at the back. Accordingly,
$$3f_n\mathrmsin\alpha =3H\left(d+g\right)\left(p_i-p_e\right)$$
(19)
The coefficient 3 in Eq. (19) accounts for the three rods.
In dimensionless form, we can then write:
$$Eu_\oint =2\left(1+\fracgd\right)Eu_e$$
(20)
where
$$Eu_\oint \equiv \frac\oint p_w\,\mathrmcos\,\theta d\theta \frac12\rho u_i^2$$
(21)
and
$$Eu_e\equiv \fracp_i-p_e\frac12\rho u_i^2$$
(22)
Figure 11 shows the plot of Eq. (20) for all the experimental conditions, showing good agreement. There is however a slight 8% bias to the right, which can be ascribed and used as an estimation of the momentum imbalance between the channel inlet and the outlet.
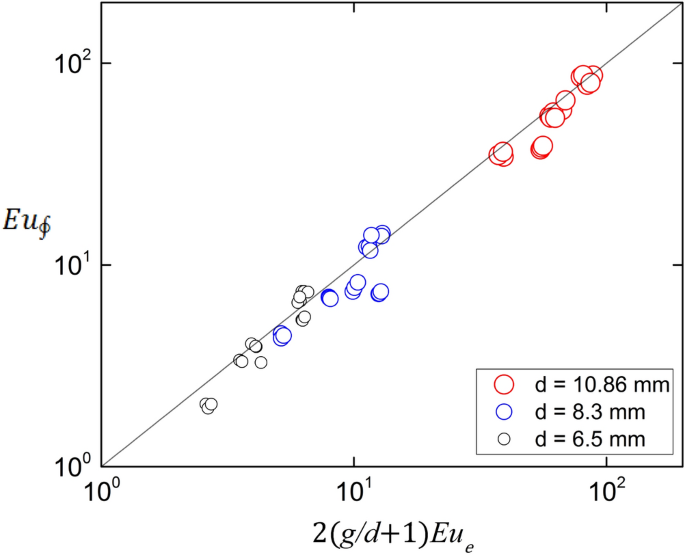
Balance of forces of the channel. The line corresponds to Eq. (20). The Pearson correlation coefficient is 0.97. Created with Gnuplot 5.4, www.gnuplot.info.


More Stories
Three Keys of Branding That Will Turn Small Business Advertising Expense into an Investment
Perbedaan Logo Design Dengan Branding
Travel Agents Can Help With Vacations and Business Travel